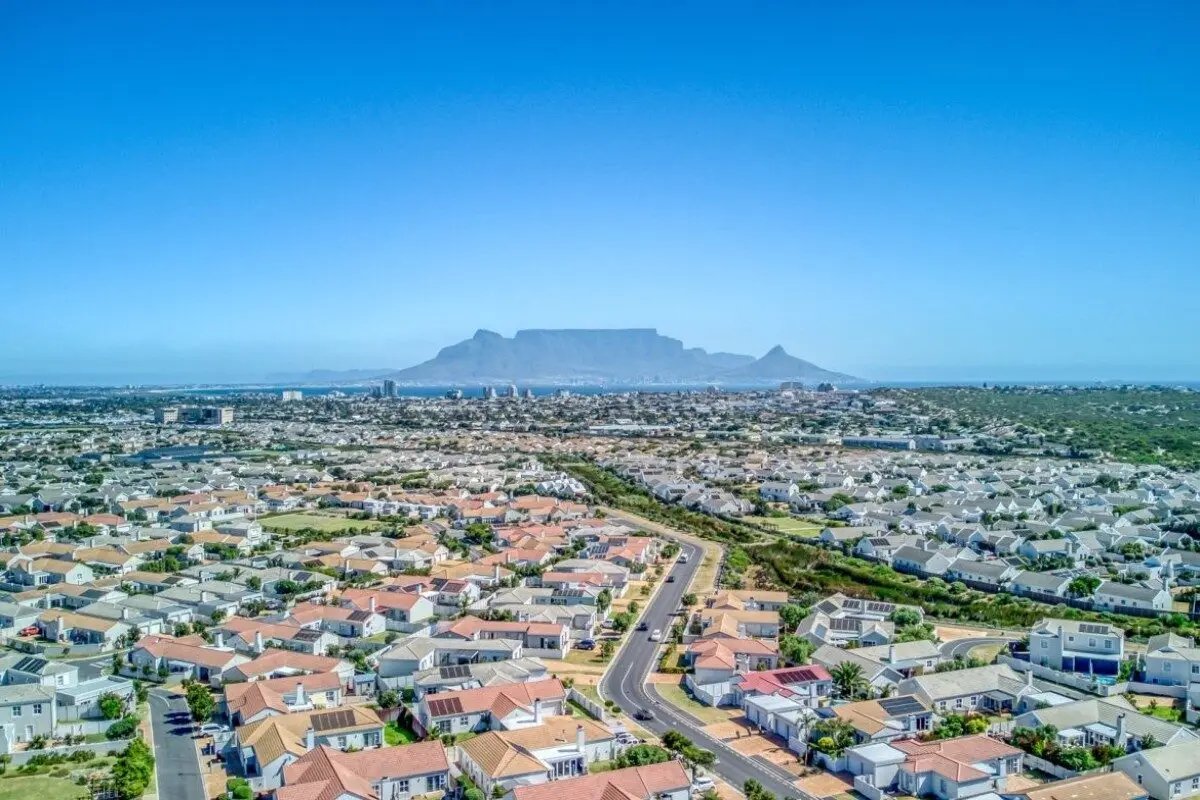

The City has released its latest Spatial Trends and Implementation Tracking report. The document gives an overview of development and land use patterns in Cape Town from 2012 to 2026.
According to the data, Cape Town has added approximately 260 000 formal residential dwellings in just 13 years, with some districts experiencing significantly faster growth than others.
Notably, the number of formal dwellings increased from 701 000 in 2012 to 961 000 in 2025.
This represents a 37% increase across the metro, reflecting continued residential development and densification.
“Densification is observed almost everywhere in the city,” the report states. “It occurs in different forms and at varying densities in different areas.”
Where NEW homes have increased the most
The biggest percentage increase was recorded in the KMPGBD district. This includes Khayelitsha, Mitchells Plain, Greater Blue Downs and surrounding areas.
The number of formal residential units in this district increased by 55% between 2012 and 2025.
Helderberg, Blaauwberg and the Northern District also recorded increases of more than 40%.
Meanwhile, the Cape Flats, Tygerberg, Southern and Table Bay districts saw growth of between 23% and 30%.
The report identifies several areas where residential density has increased. These include Blue Downs, Mfuleni and Eersteriver, as well as parts of Khayelitsha and Mitchells Plain.
In the Northern District, growth has been recorded in areas including Scottsdene, Bloekombos and Wallacedene.
The City also highlights development in areas such as Parklands, Sunningdale, Rivergate and Fisantekraal.
“Districts on the periphery of the city are continuing to exhibit lower density, sprawling development,” the report added.
What counts as a formal home?
The figures are based on the City’s General Valuation Rolls. Properties included in these records are classified as formal for the purposes of the report.
However, the City cautions that some areas showing formal densification have experienced growth in less-formal accommodation.
This includes hostels, boarding houses and blocks of flats. These are counted because they appear in the valuation data.
The report also notes that average dwelling size increased slightly over the period, from 118m² to 119m².
Informal structures in Cape Town, meanwhile, have increased by 67% over the same period. Read more on that story here.